Bachelor Thesis: Can Agents Replace Marketers?
I built a multi-agent system that reads 7,232 TikToks for a snack brand and asked 64 people to grade it. The model was fine. The humans could not agree.
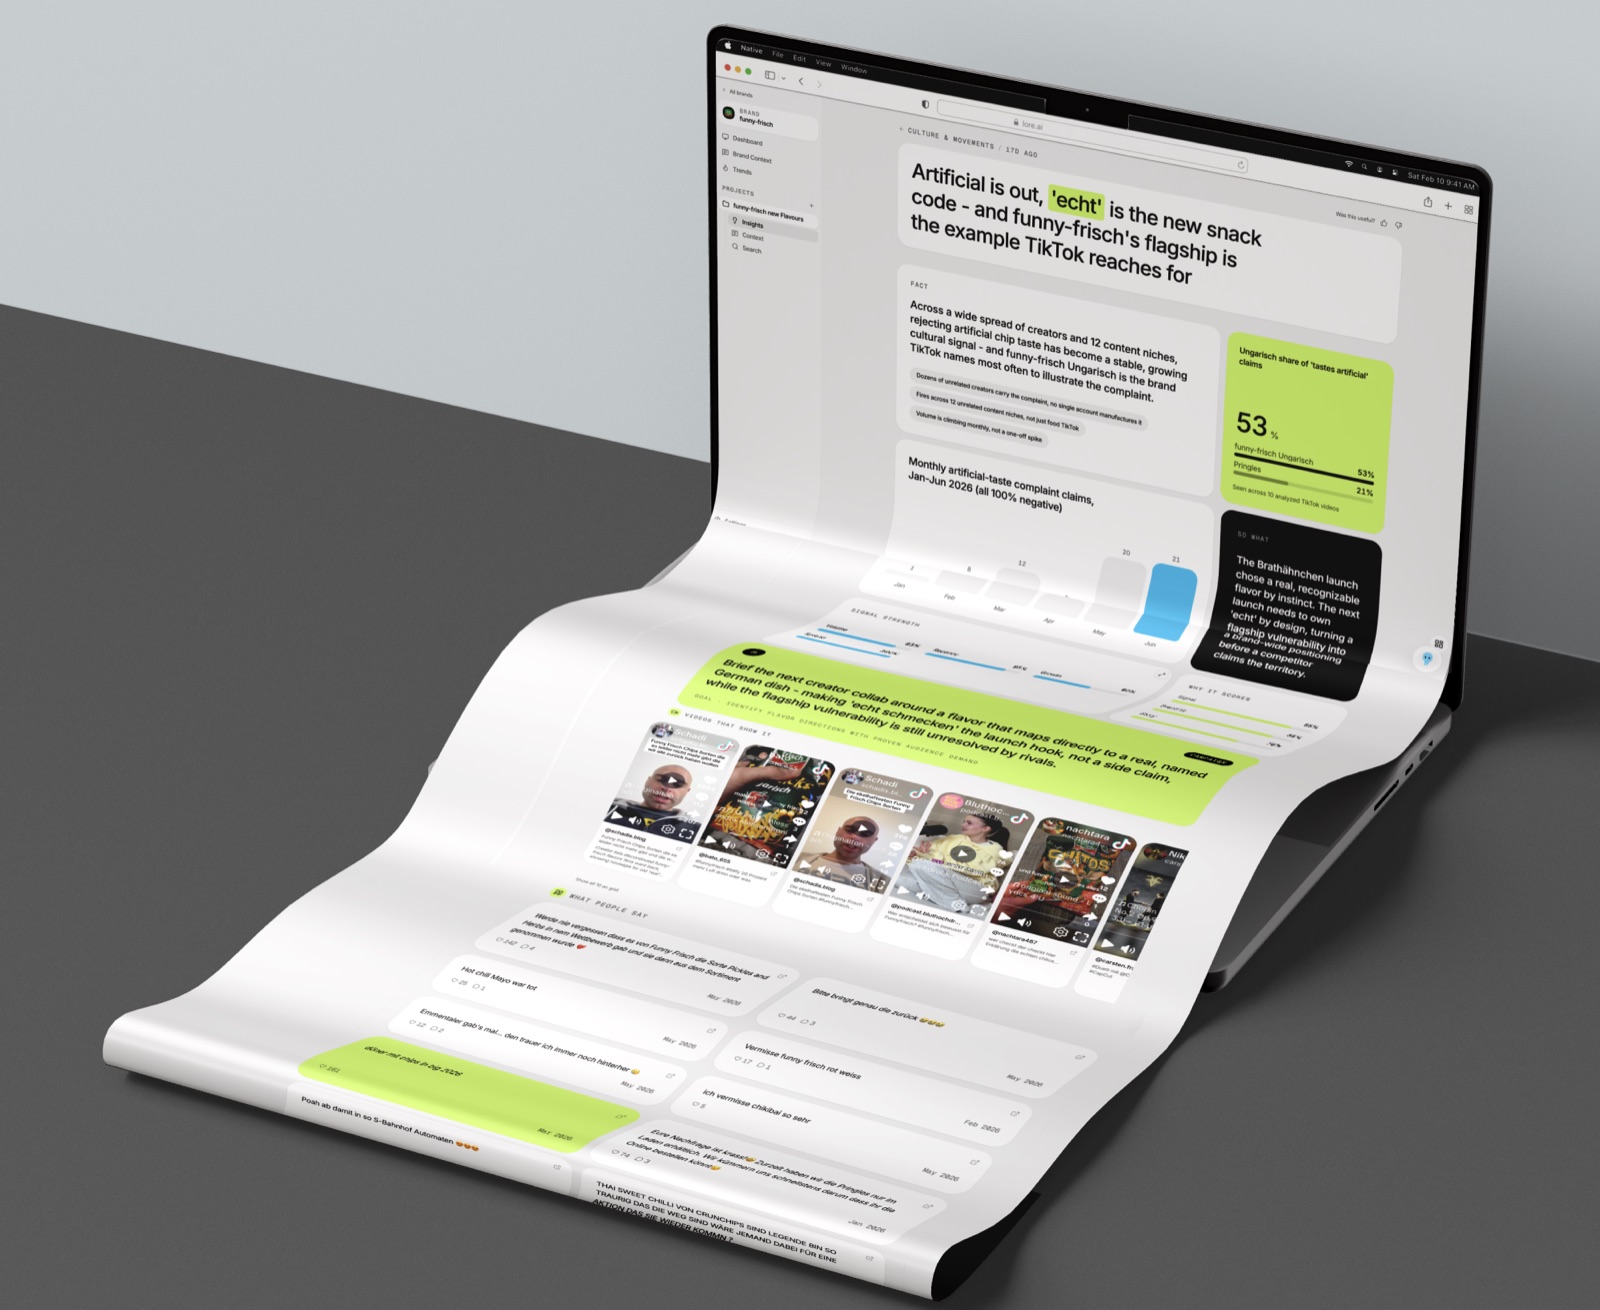
This is my Software Engineering bachelor thesis at CODE University Berlin, submitted in June 2026 and reformatted for the web. The database schema, the full analysis prompt and the per-video appendix are left out. Citations are listed at the end.
Abstract
Millions of videos are uploaded to short form platforms every hour. Brands want to know how, where and by whom their products are discussed. No marketing team can watch a feed that large and most social listening tools cannot read mentions spoken or shown on screen instead of typed.
This thesis builds a system that automates the workflow marketers use to turn short form culture into brand strategy, from reading the current culture to generating next steps. Agents run platform native search, enrich and analyze videos, extract claims and cluster them into insights for brands to work on.
The central question is whether this multi-agent system can replace the marketer end-to-end and how well its outputs hold up against human labeling and judgement.
The example project is based on the German snack brand funny-frisch. The dataset has 7,232 analyzed videos and 137,356 claims, which are clustered into 54 themes. I surveyed 64 participants on 16 videos, five themes and five insights. Raters reached Krippendorff’s alpha (α) of only 0.33 on niche and 0.09 on emotion, with 1 being perfect and 0 being chance. This shows there is no gold standard for labeling short form videos that this system could copy.
Treated as an additional rater, the system labels TikToks as consistently as humans do and its agreement scores inside the human range. Raters told intruder theme labels from real ones cleanly, though similar clusters still need stricter merging. Generated insights were rated positively, but raters reached near zero agreement on how well they were grounded and whether they would recommend them. No shared standard exists for what makes a good marketing insight.
Measured against replacing the marketing insight workflow, the system can take over labeling and claim extraction, matching human consistency and producing positively rated outputs. For insights, the low agreement on grounding and recommendation shows social media culture is still too subjective. A marketer is still needed for assuring the quality of the generated insights before delivering them to brands.
Introduction
The scaling issue
1,432 videos are uploaded to TikTok every second, roughly 116.7 million a day (Steel et al., 2025). By October 2025 Instagram, YouTube and TikTok each counted billions of monthly users along with the Chinese apps Douyin and Kuaishou (Statista, 2025a). Within Germany, TikTok reaches 43 percent of social media users (Statista, 2025b) and 69 percent of Gen Z (Statista, 2025c).
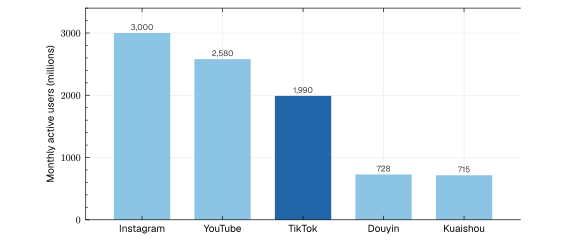
Social media platforms are where taste, slang and culture are defined and buying intent surfaces first (Dong et al., 2024). No marketing team can manually track the millions of clips published each day, least of all when most mentions are spoken or shown on screen instead of being typed.
Where social listening fails
Social listening software grew up around blogs, forums and news (Batrinca & Treleaven, 2014). Shaped by that text origin, tools such as Brandwatch or Meltwater aggregate billions of posts to count and flag spikes in brand mentions and use fixed sentiment lexicons focusing on typed text (Batrinca & Treleaven, 2014; Manovich, 2020). Most tools therefore go blind on videos where the brand is mentioned or shown on screen or in sound.
From agency to research
The idea for this thesis began as a research project inside the Berlin based marketing agency PlayTheHype. The first system used consented data with 45 participants sharing their TikTok and Instagram exports. Over 150,000 videos they had engaged with were analyzed. The pool skewed heavily toward young amateur footballers and each export was a lot of operational work that did not scale well. This is the reason why this system uses public data.
Research question and deliverables
The thesis rebuilds the manual workflow of a marketer as a system of cooperating agents and asks whether the system can replace the work in three questions measured by the survey:
- Do independent raters assign the same labels to a short form video?
- Does a current language model match human labeling?
- Can the system cluster claims, name themes and write insights a rater would hand to a brand unchanged?
Theory and methods
Netnography and its limits
This thesis is grounded in netnography, the adaptation of ethnography1 to online communities. The netnographer reads a group’s meanings, symbolism and consumption patterns from public forums and social media without intervening in any form (Kozinets, 2019).
Netnography works best at a small scale, where the researcher reads each post closely. Video defeats that scale, as transcribing and analyzing a clip often takes 10 to 100 times its running time (Krippendorff, 2004). Therefore, close reading cannot be sustained across thousands of clips and netnography goes blind at the volume of video this thesis works in.
Reading culture as data
Cultural analytics answers this scale problem by treating culture as data and finding patterns across millions of artifacts that would not surface in a smaller set (Manovich, 2020).
Video is treated as a thick narrative whose meaning unfolds across motion, rhythm and visual form. Multimodal analysis extracts that large feature set per clip (Manovich, 2020), moving past the selective canon a netnographer would pick, to analyze “everything created by everybody” (Manovich, 2016, p. 8).
Reading culture this way has a cost. Data taken at scale loses the context that gave it meaning and the counts wear a false air of objectivity, since the choice of what to count is already an interpretation (boyd & Crawford, 2012).
History of large language models
The history of modern language models begins with the transformer, which replaced recurrence with attention. Attention weighs every token against every other, regardless of distance and enables the model to read the whole sequence at once (Vaswani et al., 2017).
OpenAI’s GPT-3, a 175 billion parameter large language model (LLM), showed that scaling a transformer unlocks in-context learning (Brown et al., 2020). This means that the model is able to perform a new task from an instruction and a handful of examples without any additional training. That property of pointing one general purpose model at a narrow analysis task, like reading emotion, setting, claim or format with only a prompt, is what the system runs on.
Development of vision and multimodal models
Early video models treated video as a classification problem. The transformer was then adapted to visual data with the same attention mechanism enabling video LLMs to take visual tokens as input directly instead of converting the video to text first (Tang et al., 2025).
The vision problem is therefore largely solved, while contextual and cultural comprehension is not. On the MM-Soc benchmark no analyzed model beat a random baseline at flagging offensiveness and 8 of 10 fell below chance at judging humor (Jin et al., 2024). Models describe what is visible and read literally, where a human interprets meaning (McIntyre, 2024). Reading a meme demands a cultural judgment these models were never optimized for (Jin et al., 2024).
The Gemini family converges these lines, reasoning across image, audio, video and text in a single prompt (Gemini Team, 2024, 2025). I selected Gemini 2.5 Flash-Lite for the analysis, because of its balance in reasoning and cost. The benchmark is in the architecture section below.
Multi-agent systems
Reading a video is a single model call, but searching which videos to interpret and analyzing thousands of them is not. An agent pursues a goal by wrapping an LLM in a loop that chooses actions to engage tools, memory or other agents (Wang et al., 2023). A multi-agent system extends this through a team of role specialized agents (Guo et al., 2024).
Following the framework for autonomous agents, each agent is built from a role, memory, a planner to decompose goals and an action module to call tools (Wang et al., 2023).
ReAct (Reasoning + Acting) interleaves an LLM’s reasoning traces with actions, rather than reasoning without acting or acting without reasoning (Yao et al., 2023).
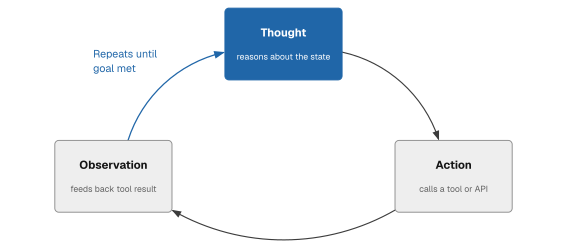
This pattern lets an agent handle the unexpected. Reasoning adapts the plan mid-run and grounding each action in real tool output keeps errors from compounding. Plain chain-of-thought cannot do this, because it never checks its reasoning against external observations (Yao et al., 2023).
These designs share one serious failure. One agent’s hallucination becomes the next agent’s input and the error compounds (Guo et al., 2024). Every added agent also multiplies model calls, so the cost and latency can make a multi-agent system a poor fit for a simpler task (Wu et al., 2023).
Interpreting big data
When interpreting large datasets, people tend to read meaningful patterns into random data (boyd & Crawford, 2012). This is the reason why agents must be prompted against misinterpretation to highlight only patterns that exist and engineers must stay aware of filters prompts imply. A critic-in-the-loop agent mitigates this by checking every theme and insight against explicit criteria, which keeps the model from mistaking a random pattern for an insight.
Design science
The method I chose for this thesis is design science, which at its core is about building and evaluating an artifact (Hevner et al., 2004). In this thesis, the build is the multi-agent system and the evaluation the survey where raters score generated labels, themes and insights.
Taxonomy
A taxonomy is a fixed vocabulary that raises a model’s reliability by limiting its label options (Nickerson et al., 2013). An early version of the system produced over 40,000 different values for video settings across 150,000 videos, with most of them being synonyms for the same few scenes. Left to itself the model improvises.
How to build a taxonomy
I failed building a taxonomy by hand almost every time. The first pilot forced each video into about 20 buckets derived from the first 100 analyzed videos. It was too coarse and many videos collapsed into “other”, a known limit where no fixed list keeps pace with a dataset that grows every day (Nickerson et al., 2013).
I split that single topic field into two: the niche of the video and the claims made in it. Niche is anchored to Tier 2 of the IAB Content Taxonomy v3.1, a non peer-reviewed advertising standard (IAB Tech Lab). The model applies an existing IAB category where one fits and coins an IAB-style label when none does, so the fixed tier keeps clips comparable while the coined label reaches content the standard never foresaw (Kundisch et al., 2022).
A claim is an actionable opinion about a brand or product. Each claim has four parts: product, product type, marketable aspects (quality, value, design, convenience, sensory, health, ethics, status or demand) and sentiment (1 to 5). This adapts the quadruple from aspect based sentiment analysis (Zhang et al., 2022) and is the base for the themes in this system.
Sentiment, a long established polarity classification task that models handle reliably (Pang et al., 2002), is scored per video from one to five. Full video sentiment and claim sentiment are kept apart because they diverge. For example, a clip can run upbeat while it criticizes a product or praises another. A brand wants to know which.
Closed taxonomies
The remaining fields like emotions, settings or formats stay closed with predefined options, since an analyst sorts a feed by them and a closed set lets an agreement statistic test them cleanly.
An early version used the 27 categories of Google’s GoEmotions (Demszky et al., 2020), but they were too fine grained for the model to apply reliably. I cut the set to 10 based on Plutchik’s eight primary emotions (Plutchik, 1980) and added a neutral default and gratitude.
The setting field groups the Places365 scene taxonomy (Zhou et al., 2016) into 22 categories. For format I derived 16 labels by manually labeling videos. The agent labels them by running a priority ladder where the first matching label wins.
No finite vocabulary fits an open and shifting world exactly, so the aim of the taxonomy is achieving a low rate of wrong labels. The taxonomy needs to be refined against the data as social media culture evolves.
System architecture
Overview
The system is a React web app built with TanStack Router and Hono with tRPC in the back-end. The monorepo is powered by Turborepo. The storage runs on Neon Postgres and ClickHouse, splitting operational from analytical workloads. All agents run on the Mastra framework, because of the benefits of its unified model interface, durable workflows, persistent memory across an agent’s tool calls and per-tenant tool scoping. Langfuse is used to trace and audit every model call.
The system splits predictable work to an always on Render worker and judgement work to Mastra agents. The worker runs jobs such as scraping, enriching, analyzing and clustering and the agents take over the decisions that cannot be specified in advance, like which search terms to expand or which insight is worth building.
The architecture was built iteratively by agentifying my marketing colleagues’ workflow one task at a time. I started automating the video analyzing pipeline first and expanded to agents when a judgement step and multiple tools were needed.
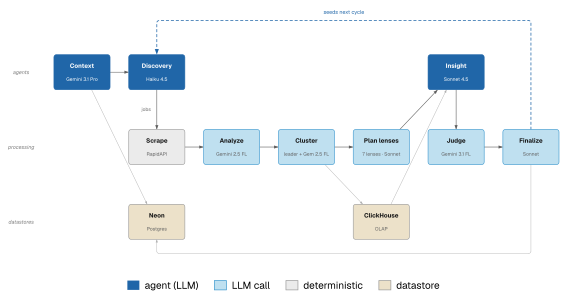
The model choice behind each stage depends on how relevant intelligence is for the step. Stages where intelligence matters most and run rarely, like the context agent, get a stronger model than high frequency steps such as scraping.
The context and discovery agents
The context agent (Gemini 3.1 Pro) builds the brand and project context as a live document, regenerating the briefing when the user attaches new files or their chat rewrites it. Holding this context reliably depends on a well defined prompt that extracts the most relevant information.
The discovery agent (Haiku 4.5) derives search terms, hashtags and creators from the context, the brief and prior insights. The first cycle casts wide and each later cycle narrows the terms, building a broad overview of a brand’s social landscape before focusing on the most relevant search terms and creators.
Multimodal analysis
Videos and creators surfaced by discovery are enriched through RapidAPI and analyzed with a fixed taxonomy and schema. The system uses unofficial TikTok APIs hosted on RapidAPI instead of the official TikTok Research API, because the official API caps returned posts, omits whole regions and yields samples that are not representative (Steel et al., 2025). Bypassing those caps buys a near-complete slice of a timeframe, a trade I make for coverage. The legal side is addressed in the ethics section.
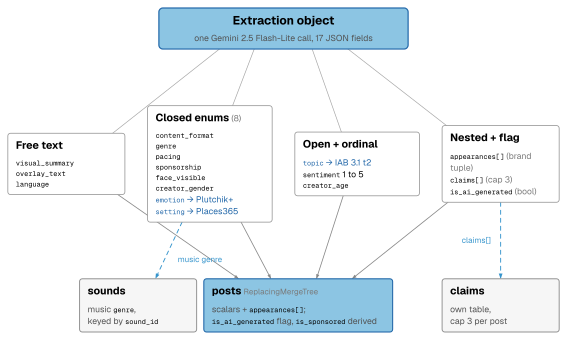
The pipeline’s most frequent errors are unexpected output shapes such as generated niches or settings outside the taxonomy. A JSON schema constrains closed fields at generation time and a second pass in the worker enforces the taxonomy. It drops a brand appearance outside its enum, rewrites an out of vocabulary placement to “none” and normalizes the niche instead of rejecting it.
The harder issue no gate can catch is a label that is well formed and aligned with the taxonomy, but simply wrong.
Concurrency and reliability
For the system to run efficiently, jobs run in parallel while sharing the Gemini and RapidAPI rate limits. Failed model calls are retried up to three times and transient errors wait 60 seconds before the next attempt. The worker batches enrichment and analysis jobs into sets of 200 elements per run and saves a timestamp for each, so it can resume cleanly after a failed job or shut down. The number of projects running in parallel is capped by the memory of the worker’s container on Render.
Choosing the best vision model
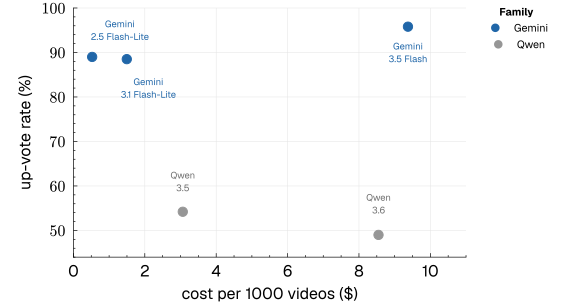
To find the best model, I scored five vision models from Google and Qwen by hand, each on a short and an extensive prompt. The longer prompt improved results for every model. After rating a few dozen videos, the Gemini models were clearly ahead with over 80 percent upvotes, while both Qwen models sat near a coin flip.
Gemini 2.5 Flash-Lite rose from 84 percent upvotes on the short prompt to 89 percent on the extensive one, at 0.23 and 0.53 dollars per 1000 videos.2 Google’s newest model, Gemini 3.5 Flash, reached 95.8 percent on the extensive prompt at roughly 18 times the cost. That makes 2.5 Flash-Lite competitive on quality at a fraction of the price and overall the best model for the enrichment pipeline.
Claims to themes
Claims are individual statements or opinions extracted from a video. Because opinion also surfaces in the comments, the system extracts claims from the 25 most liked comments per video as well. To build useful brand recommendations, claims are clustered into themes.
Each claim is embedded with Gemini Embedding 001 into a 1536 dimension vector and tagged with its product type and which aspect of the product or brand the claim is about. The system clusters claims so that near-duplicates like “too salty” and “far too much salt” land together. Standard algorithms such as k-means and HDBSCAN (Campello et al., 2013) see only the vector geometry and would merge claims across the product and aspect tags. To prevent this, the system uses a single-pass leader algorithm to cluster claims (Hartigan, 1975, sec. 3.2). Each claim folds into the nearest centroid above a 0.88 similarity threshold or seeds a new one. A final union-find pass then merges centroids to prevent similar themes. Gemini 2.5 Flash-Lite names a cluster and promotes it to a theme once it holds at least 25 claims from three different posts.

Insight agent loop
Generating an insight from nothing is hard for an LLM. This is why, together with my colleagues, I derived a framework across seven lenses: culture, themes, formats, creators, communities, brand and competition. Each with its own question, tools and example headline shape.
A planner agent (Claude Sonnet) opens each cycle, reading the context document and setting up to four brand goals and weighing relevance for every lens (0 to 1).
The insight agent is built on the ReAct pattern, combining reasoning with tool calls to pull useful posts, themes and claims. Each insight is structured to provide evidence, reasoning and an actionable next step. A judge (Gemini 3.1 Flash-Lite) then scores each element of an insight to prevent claims without correct evidence.
A finalizer accepts, merges or discards each insight against what the brand has already seen and ranks the survivors by lens. The discovery agent also reads the published insights to seed the next cycle.
Storage and state
The first system stored all data on Neon Postgres. Once the video dataset grew, the queries behind every dashboard became too slow. I therefore migrated the analytical load to ClickHouse, a columnar OLAP (Online Analytical Processing) store optimized for scanning and aggregating one column down millions of rows.
As Postgres handles transactional data better, it holds users, brands, projects, context and proposed insights. ClickHouse primarily stores the videos, comments, claims and themes. To save model analysis, multiple projects can access analyzed videos through a shared log table, while none can access another project’s themes or sensitive information.
Evaluation design
To simulate a real world brand research case, I generated an example project with the context agent building the project context for the German snack brand funny-frisch. Since evaluating all 7,232 analyzed videos by hand is not feasible, I built a survey over a sample of the videos, themes and insights the system produced.
| Field | Value |
|---|---|
| Project | funny-frisch new flavours |
| Brief | New funny-frisch taste with a new face and flavor |
| Goal | Launch a new flavour fronted by a creator to succeed Heidi Klum, building on the Chipsfrisch Brathähnchen Style (vegan roast chicken) flavour announced at OMR. Find the next creator face and a trending flavour, benchmarked against the Heidi Klum roast chicken campaign and mine TikTok comments for the flavours customers ask for. Primary channel: TikTok |
| Audience | German snack consumers, especially Gen Z and millennials active on social media |
| Category position | Leader |
| Monitored brands | funny-frisch, chipsfrisch, intersnack |
| Monitored hashtags | funnyfrisch, chips, snacktest, foodtrend, supermarktneuheit, geschmackstest, neuimsortiment, probieren |
| Tracked products | chips, kartoffelchips, snack |
| Confirmed competitors | Lay’s, Pringles, Crunchips, Doritos, Kettle Brand, Mondelez |
Table 1. The funny-frisch project and brand context.
Corpus and sample
The discovery agent ran 97 search, creator and hashtag jobs. All videos were uploaded between 13 December 2025 and 8 June 2026, are mostly in German and have a median length of 47 seconds. Engagement follows a power law, with the median video having 57,795 plays and the largest 53.6 million. Most creators are small and 82 percent have under 100,000 followers.
| Measure | funny-frisch |
|---|---|
| Discovery jobs | 97 |
| Analyzed (multimodal) | 7,232 |
| Distinct creators | 3,082 |
| German / English videos | 5,233 / 1,696 |
| DACH share of analyzed videos | 74% |
| Median / max plays | 57,795 / 53.6M |
| Median clip duration | 47 s |
Table 2. Video corpus of the funny-frisch project.
Statistical approach and labeling agreement
Cohen’s kappa measures how much the labels of two independent coders agree with each other (Cohen, 1960). To measure agreement across any number of coders and because the coding scheme mixes categorical and ordinal fields, I use Krippendorff’s alpha (α) instead of Cohen’s kappa (Krippendorff, 2004). Krippendorff’s alpha is defined as α = 1 − Do / De, where Do is the observed disagreement and De the disagreement expected from random labeling. Disagreement is measured per field, as distance on the scale for sentiment and Likert axes and disagreement in chosen label for categorical fields such as niche and format.
Following Krippendorff, an α of 0.800 or higher indicates reliable agreement. Values between 0.667 (2/3) and 0.800 permit only tentative conclusions and values below 0.667 are not considered dependable (Krippendorff, 2004).
The pipeline is scored against the label the majority of raters chose, since it is the best available ground truth, as no truly correct label is available. Accuracy describes on how many videos the pipeline matches that majority label and is compared to the majority-class floor.3 For sentiment, I report how often the pipeline lands within one point of the majority.
Furthermore, each accuracy figure carries a Wilson score 95 percent confidence interval (Wilson, 1927), the range the true score would plausibly fall in on a different sample of videos. With only 16 videos, a single clip shifts the accuracy by over six points, which explains the wide interval.
The α intervals come from a cluster bootstrap over 1,000 resamples, which repeatedly redraws whole videos at random and recomputes α to measure how much it varies. Drawing whole videos rather than single ratings keeps the agreement within a clip intact, so the interval is not made artificially narrow.
I also report the composition and gaps in rater demographics.
Development of the evaluation
The first survey presented 50 videos to six raters (3 marketers, 3 non-marketers), but its length reduced completion rate and therefore I cut the set to 16 videos. I also moved from the IAB 3.1 Tier 2 taxonomy, with over 300 labels, to the 37 grouped Tier 1 categories, since many labels were missing and the higher level proved both sufficient and more feasible. The shorter survey, with 16 videos, five themes and five insights, was completed by 64 raters.
My first design only scored how often the pipeline matched the raters’ label. But the assumption that human labels are stable breaks down, since even trained coders may not clear α > 2/3 on subjective cultural videos (McIntyre, 2024; Krippendorff, 2004). I rebuilt the evaluation to compare the human labels first and establish consensus and later score the system against it. Agreement between raters is quantified with α across profession (marketers vs non-marketers), age, gender and AI nativeness (AI use, AI optimism and trust in AI for correct labeling and decisions).
Hence, the system is judged against the human ceiling, not an absolute standard, which fits the subjective nature of labeling short form videos.
Building the survey
The survey runs in three parts, one for each of the pipeline’s main outputs.
Part 1: Labels. Each rater labels the same videos blind on niche, format, emotion and sentiment. The 16 videos are a sample, drawn from the 7,232 analyzed videos in the funny-frisch project, spanning a range of engagement, format, niche and emotion.
Part 2: Themes. A sample of five themes that build upon claims in the project went into the survey, each bundling 10 sampled claims under one label. Raters scored them on coherence of claims and fit of the label on a five point Likert scale4 (Likert, 1932).
The check adapts the intrusion logic of Chang et al. (2009), where an item that does not belong reveals an incoherent cluster. I gave two of the five themes a decoy label and left the model’s own label on the other three. Raters scored every theme blind and a genuine theme should draw a high label fit and a decoy a low one. Grounding theme quality in human judgment over an automated coherence score follows evidence that automated scores correlate poorly with human assessment (Hoyle et al., 2021).
Part 3: Insights. The agent produced 24 insights in this project, of which 13 were accepted by the LLM judge. A random sample of five went into the survey and were each scored on whether the finding is well grounded and whether the rater would recommend it on a five point Likert scale. As insights build on analyzed videos, extracted claims, comments, context and themes, they are the deepest test of the system’s capability to replace the marketer’s manual workflow.
Survey tool
I built the survey as a React web application with an embedded TikTok player. Each rater consented once, answered questions on demographics and then worked through the 26 items in randomized order with the pipeline’s labels hidden to avoid influencing their responses. The application timed every answer and recorded edits and revisits.
Results
The survey ran from 15 to 18 June 2026 and was finished by 64 raters, each completing all 26 items. The pool was recruited through personal outreach, social media and referral.
Rater pool distribution
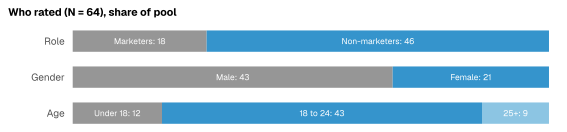
Of the 64 raters, 18 work in marketing and 46 do not, 43 are men and 21 women, 43 are aged 18 to 24, 12 under 18 and 9 are 25 or older.
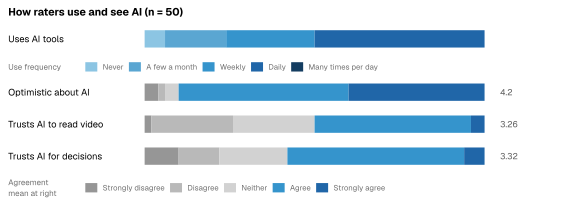
Fifty of the 64 raters answered the AI questions with optimism scoring highest at a mean of 4.2 on the five point Likert scale.
Human labeling agreement
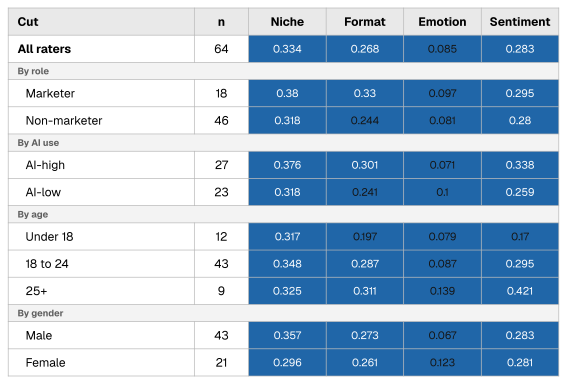
Each rater labeled the same 16 videos in a random order on niche, format, emotion and sentiment. Agreement across the 64 raters, measured with α, is 0.33 on niche, 0.27 on format, 0.28 on sentiment and 0.09 on emotion.
Niche, format and emotion are read with the nominal metric and sentiment with the ordinal one. The cluster bootstrap, which resamples whole videos to get intervals robust to per-video correlation, puts the 95 percent intervals at 0.19 to 0.44 on niche, 0.17 to 0.34 on format, 0.14 to 0.39 on sentiment and 0.05 to 0.11 on emotion.
Inside each demographic cut, marketers reach 0.38 on niche against 0.32 for non-marketers and the AI-high half runs 0.38 against 0.32 the same way. No cut lifts emotion above 0.14 and no field reaches the agreement floor Krippendorff sets for tentative conclusions (α > 2/3).
Rater agreement per video varies widely. For niche, rater agreement ranges between 0.20 and 0.95, on format between 0.22 and 0.80, but emotion never surpasses 0.50.
Pipeline labeling agreement
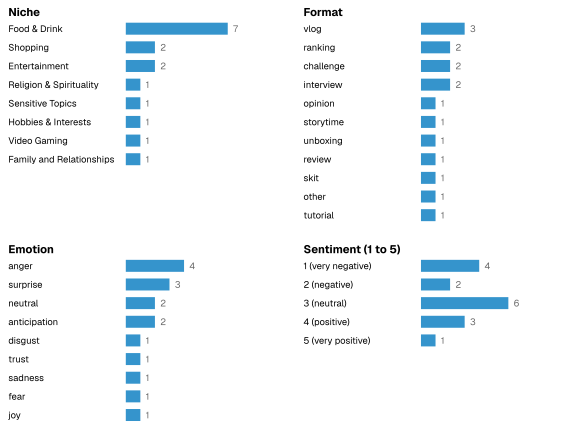
The pipeline assigned niche “Food & Drink” to 7 of 16 videos, used 11 of 16 format categories and used mostly anger and surprise as emotions. Sentiment centered in the middle, with six clips having a sentiment of 3 (neutral) and four videos being very negative.
Pipeline-human agreement
The pipeline matches the rater majority on 10 of 16 clips for niche, 8 of 16 for format and 6 of 16 for emotion. That clears the majority-class floor on niche (5 of 16) and format (4 of 16), but falls below it on emotion (9 of 16).
Because the pipeline writes free form strings, I remapped them to the 37 IAB 3.1 Tier 1 groups before scoring. After the remap every pipeline label on these 16 clips matched one the rater could choose. The finer Tier 2 niche is not tested by this match and sentiment landed within one point of the human median on 14 of 16 clips.
Treating the pipeline as one more coder places it inside the human spread. Pairwise, agreement between the pipeline and humans matches human-human agreement almost exactly, 0.46 against 0.44 on niche, 0.35 against 0.34 on format, 0.26 against 0.24 on emotion and 0.33 against 0.33 on sentiment. Adding the pipeline as a coder moves no field’s α by more than 0.004.
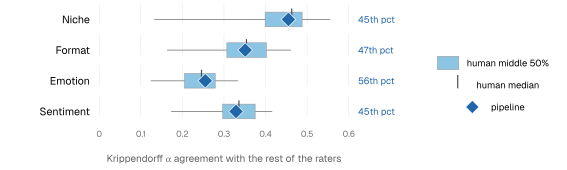
The per rater agreement with the pipeline improves when comparing AI native raters. The AI-high half matches the pipeline on 50 percent of niches against 42 percent for the AI-low half. Format and emotion show no association.
Themes and insights
The raters graded five themes on coherence of claims and theme label fit, where three themes had the model’s own label and two an intruder. The three real themes drew a mean label fit of 4.15 and the two intruders 1.66, showing a gap of 2.5 points. Coherence split the same direction with 4.30 against 2.73.
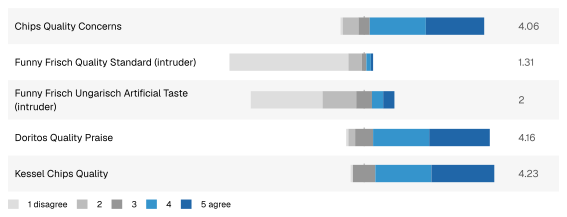
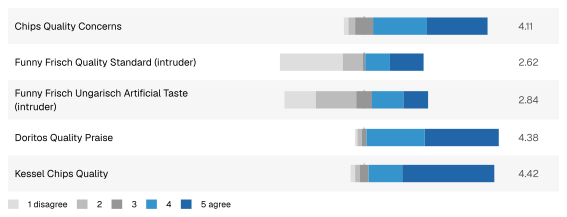
Raters scored five generated insights on two axes, whether each insight was well grounded and whether they would recommend it to the brand. Both means were positive, 3.55 for grounding and 3.34 for recommendation.
Agreement across raters was low, with an α of 0.02. This does not contradict the positive means, because the two numbers describe different levels. The mean folds every rater into one score per insight and yields a clear order, while the low α shows that individual raters did not agree on where any single insight falls on the scale.
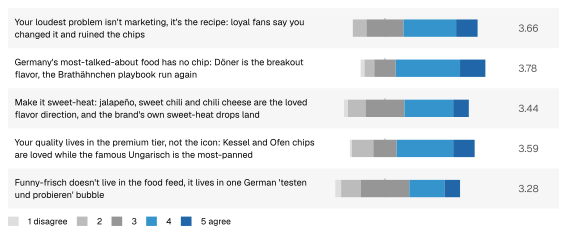
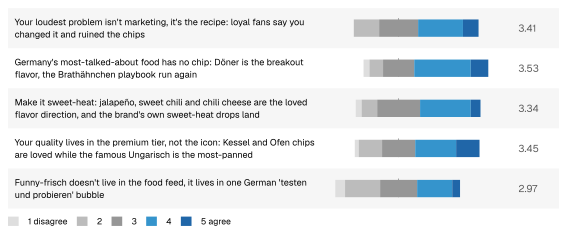
Marketers rated grounding 0.49 points above non-marketers, so part of that standard sits with domain experience. Recommendation showed a smaller gap of 3.46 against 3.30 and neither age nor AI-nativeness produced a comparable gap on either axis.
Discussion
Human reading agreement
In my study, human raters do not agree when labeling short form videos. Agreement never exceeded an α of 0.33 on any field and emotion at 0.09 sat close to what random labeling would produce (Krippendorff, 2004). Sentiment and niche held the most agreement and emotion the least. That makes emotion the most interpretive of the four.
I expected the marketers to set a gold standard, but they agreed only marginally more with each other. This leads to the conclusion that short form video itself with visuals, slang, sound and non-verbal cues is read differently by two viewers.
A clearer onboarding and instructions in the survey might have lifted the numbers, but labeling short form video stays subjective.
AI and human labeling
Read as another rater, the pipeline lands between the first and third quartiles on every field. It shifts the group agreement so little that an outside coder could not tell its labels from a person’s.
Its accuracy against the rater majority is mixed. The model matches humans most closely where the label follows a fixed taxonomy and least where it needs judgement. Niche agrees best, sentiment tracks the human median closely and emotion agrees least.
The system labels about as consistently as the average rater, though whether that holds across another set of videos is untested. When humans have no shared answer, neither the system nor any single rater can provide one.
Emotion proves the point from the other side. It is the field humans agree on least and the only one where the pipeline drops below the majority baseline. With no shared human signal to match, the model can do no better than guessing the most common emotion. The 16 clip sample cannot sharpen that further.
Theme labels and clustering
The third question, whether the system produces themes and insights a rater would hand to a brand unchanged, can be overall confirmed. Claims are clustered and named reliably by the model.
Raters distinguished the model’s own labels from planted intruders by a 2.5 point gap in label fit, the highest agreement in the study. Merging similar clusters would probably raise the agreement further.
Evaluating generated insights
The positive means say the insights read as plausible, but the near zero agreement says the raters cannot decide which one is good. Plausibility is cheap but telling a strong insight from a merely plausible one needs a reader who holds a standard. Marketers rated grounding about half a point above non-marketers, so domain experience supplies part of that standard.
Insights inherit every gain in the claims, themes, context and videos beneath them, so improving those layers improves the insights. The largest gain would come from involving more experienced marketers. Their workflows of how they synthesize strategy and market research from social media would strengthen the framework behind the insight agent.
Limitations
The most obvious limitation is the rater pool. The 64 raters skew young and male, without marketing background.
The cuts by profession, age, gender and AI nativeness are underpowered and the survey cannot confirm an anonymous rater’s claimed profession.
The 16 analyzed videos are a narrow slice of the more than 7,000 videos in the project.
Also, the study runs on one brand in one category. It therefore cannot claim that the results of the system carry to another brand or market.
Although different models are used in the system, all video labels are produced by the same model (Gemini 2.5 Flash-Lite), which ties the labels to a single model’s bias (Lones, 2024).
Further, I should flag my own bias. I designed the pipeline and system, decided which taxonomy to use, rated the models in my own benchmark, built the survey and interpreted the results.
Data and ethics
Every video inside the system was uploaded by someone who never agreed to be studied. Although I need public data for scale, access does not mean free use. Treating the two as the same moves content out of its social sphere into research, where the creator can no longer control where it travels and public availability alone does not make that content free to repurpose (Zimmer, 2010).
Video makes the exposure sharper, as face and embedded metadata such as location reveal far more than text alone (Hennell et al., 2020). If scattered public points are combined, profiles can be built that the subject never chose or consented to publish (Metcalf & Crawford, 2016).
Legal frame
The central legal question in this project is whether public TikTok data may be collected through unofficial APIs.
The GDPR (General Data Protection Regulation) law handles personal data in the EU. A documented legitimate interest provides the lawful basis for research and removes the need to seek consent where the processing poses no risk to individuals (Brown et al., 2024). GDPR Article 89 relaxes certain data subject rights when safeguards like pseudonymization and data minimization are applied (Brown et al., 2024).
The main legal issue is the use of unofficial APIs to collect the data, which breach the platform’s terms of service (TOS). Researchers have argued that TOS restrictions are a weak ethical guide for research, since anti scraping clauses are written to forbid all automated collection regardless of purpose (Fiesler et al., 2020). Courts have moreover been more willing to set aside such provisions when the data is publicly available, the scraper does not log in and the scraping causes the platform no demonstrable harm (Brown et al., 2024).
Because the system collects only public fields without authentication, has strict rate limits and only uses minimized data, I argue that scraping TikTok for this thesis carries acceptable legal and ethical risk.
Survey participants
The survey ran on no personal data and took consent from each of the 64 raters on the first screen of the app. No name, contact or account was stored, only answers on demographics.
System bias and fairness
Bias enters the system at three points: the sample, the scheme and the model.
First, the videos the model analyzes are filtered by the search terms the discovery agent generates and the platform’s native search, which is not random and returns limited videos (Bai & Gu, 2026; Steel et al., 2025).
The pipeline then filters by what the schema can represent, dropping any claim below a confidence of seven and mapping labels to “none” or “other” when no label fits. Models therefore label whatever is easy to describe and novel or unexpected content is either dropped or generalized away.
Third, models add their own error, which is rarely random. False labels cluster on attributes such as gender, education or status (Ashwin et al., 2025).
Models also overpredict sparse categories, making rare patterns appear more common than they are (Ashwin et al., 2025). A model is only as good as its training data, which leads it toward a dominant reading that takes the literal sense and loses the irony short form video lives on (McIntyre, 2024).
A further bias comes from the judges. A critic trained on the same data can repeat flaws or biases it should catch, compounding existing errors. Strengthening the critic’s prompt reduces this, but the risk is never zero when the judge is itself an LLM.
Replacing the marketer
When a system is built to replace a job, displacement becomes a central ethical issue and a harm of LLMs (Wen et al., 2025). The counterargument is that automation augments the marketer in my case rather than replacing, by shifting work from scrolling and manually labeling videos to briefing the system and assuring the quality of its output.
The gap that keeps a human in the loop is the judgement of culturally fluent marketers (Ashwin et al., 2025). Current models are trained on the past and might miss current irony and trends short form culture runs on (McIntyre, 2024; Zhang et al., 2024). Replacement in this system reaches the labeling and the aggregation, but stops at judgement as insights still need to be assessed for quality.
Nevertheless, it requires rising skill which displaces everyone below it, concentrating the benefit and augmentation in the few who can reliably validate what the system produces.
Conclusion
This thesis asked whether a system of cooperating agents can replace a marketer in building brand insights and the answer is twofold.
Full replacement is not feasible today, but the manual work of labeling videos, clustering claims and producing insights can be automated. This currently moves the marketer’s role from building those insights to assuring their quality.
The pipeline labels short form videos about as reliably as human raters do. It clusters claims, names themes and produces insights that independent raters judge as well grounded and would recommend to brands.
The harder finding is that the challenge in labeling TikTok videos reliably is not the model itself, but the absence of agreement among human raters. A model therefore has no objective truth it can be measured against. The solution is not a stronger model with more parameters, but a better human reference and guideline for the prompt.
A small set of the best marketers with deep fluency in TikTok culture could help align the system and learn from their labeling. Nevertheless, the system today already labels about as reliably as humans do.
The work also shows that more granular taxonomies work against reliability rather than for it. Finer categories are harder for both models and humans to apply consistently. The full IAB Content Taxonomy v3.1 at tier 2, with more than 300 categories for example, is overkill for a model and GoEmotions, with its 27 emotions, proved too fine grained to apply reliably. Compact taxonomies outperform extensive and overengineered ones, when fitted to what both models and people can apply consistently and to the purpose of the taxonomy.
The system is not finished, though. Beyond matching its labels, themes and insights to expert raters, the most promising direction is to extend the data to a large and frequently synced body of private exports. This would open the door to trend analysis and prediction based on patterns of sounds, creators and formats, directly showing brands and marketers which signals shift the audience’s interest.
Refining claim extraction towards brand relevant claims and tightening the clustering are further improvements for achieving the best actionable insights possible.
Within the conditions tested here, the practical implication is that agencies and in-house brand marketing teams that adopt similar systems can generate insights at a scale and speed no manual work can currently accomplish. This already translates into a competitive advantage for those using it.
To the best of my knowledge, this is the first system to combine multimodal analysis with a large set of TikTok data for market research and strategy. It establishes the baseline for a system that could also be a standalone product to disrupt traditional social listening and market research tools.
As it stands, it is a working baseline for that kind of system. With the model improvements expected over the coming months and further development, it could shift how brands and agencies conduct data based research and strategy on highly subjective content.
References
- Ashwin, J., Chhabra, A., & Rao, V. (2025). Using large language models for qualitative analysis can introduce serious bias. Sociological Methods & Research.
- Bai, D., & Gu, Y. (2026). Harnessing big data, hindered by bias: Evaluating TikTok Research API for fair and optimal social sciences.
- Batrinca, B., & Treleaven, P. (2014). Social media analytics: A survey of techniques, tools and platforms. AI & Society.
- boyd, d., & Crawford, K. (2012). Critical questions for big data: Provocations for a cultural, technological, and scholarly phenomenon. Information, Communication & Society.
- Brown, M. A., Gruen, A., Maldoff, G., Messing, S., Sanderson, Z., & Zimmer, M. (2024). Web scraping for research: Legal, ethical, institutional, and scientific considerations. arXiv.
- Brown, T. B., et al. (2020). Language models are few-shot learners. arXiv.
- Campello, R., Moulavi, D., & Sander, J. (2013). Density-based clustering based on hierarchical density estimates.
- Chang, J., Gerrish, S., Wang, C., Boyd-Graber, J., & Blei, D. (2009). Reading tea leaves: How humans interpret topic models. Advances in Neural Information Processing Systems.
- Cohen, J. (1960). A coefficient of agreement for nominal scales. Educational and Psychological Measurement.
- Creswell, J. W., & Creswell, J. D. (2017). Research design: Qualitative, quantitative, and mixed methods approaches. SAGE.
- Demszky, D., Movshovitz-Attias, D., Ko, J., Cowen, A., Nemade, G., & Ravi, S. (2020). GoEmotions: A dataset of fine-grained emotions. arXiv.
- Dong, X., Liu, H., Xi, N., Liao, J., & Yang, Z. (2024). Short video marketing: What, when and how short-branded videos facilitate consumer engagement. Internet Research.
- Fiesler, C., Beard, N., & Keegan, B. C. (2020). No robots, spiders, or scrapers: Legal and ethical regulation of data collection methods in social media terms of service. Proceedings of the International AAAI Conference on Web and Social Media.
- Gemini Team (2024). Gemini 1.5: Unlocking multimodal understanding across millions of tokens of context. arXiv.
- Gemini Team (2025). Gemini 2.5: Pushing the frontier with advanced reasoning, multimodality, long context, and next generation agentic capabilities. arXiv.
- Google (2026). Gemini Developer API pricing.
- Guo, T., Chen, X., Wang, Y., Chang, R., Pei, S., Chawla, N. V., Wiest, O., & Zhang, X. (2024). Large language model based multi-agents: A survey of progress and challenges. arXiv.
- Hartigan, J. A. (1975). Clustering algorithms. John Wiley & Sons.
- Hennell, K., Limmer, M., & Piacentini, M. (2020). Ethical dilemmas using social media in qualitative social research: A case study of online participant observation. Sociological Research Online.
- Hevner, A. R., March, S. T., Park, J., & Ram, S. (2004). Design science in information systems research. MIS Quarterly.
- Hoyle, A., Goel, P., Hian-Cheong, A., Peskov, D., Boyd-Graber, J., & Resnik, P. (2021). Is automated topic model evaluation broken? The incoherence of coherence. arXiv.
- IAB Tech Lab. IAB Tech Lab Content Taxonomy 3.1.
- Jin, Y., Choi, M., Verma, G., Wang, J., & Kumar, S. (2024). MM-Soc: Benchmarking multimodal large language models in social media platforms. arXiv.
- Kozinets, R. (2019). Netnography: The essential guide to qualitative social media research. SAGE.
- Krippendorff, K. (2004). Content analysis: An introduction to its methodology. Sage.
- Kundisch, D., Muntermann, J., Oberländer, A. M., Rau, D., Röglinger, M., Schoormann, T., & Szopinski, D. (2022). An update for taxonomy designers. Business & Information Systems Engineering.
- Likert, R. (1932). A technique for measurement of attitudes. Archives of Psychology.
- Lones, M. A. (2024). Avoiding common machine learning pitfalls. Patterns.
- Manovich, L. (2016). The science of culture? Social computing, digital humanities and cultural analytics. Journal of Cultural Analytics.
- Manovich, L. (2020). Cultural analytics. The MIT Press.
- McIntyre, J. (2024). Using AI for qualitative labeling: Consistency and comparisons. PhD thesis.
- Metcalf, J., & Crawford, K. (2016). Where are human subjects in big data research? The emerging ethics divide. Big Data & Society.
- Nickerson, R., Varshney, U., & Muntermann, J. (2013). A method for taxonomy development and its application in information systems. European Journal of Information Systems.
- Pang, B., Lee, L., & Vaithyanathan, S. (2002). Thumbs up? Sentiment classification using machine learning techniques. arXiv.
- Plutchik, R. (1980). A general psychoevolutionary theory of emotion. In Theories of emotion. Academic Press.
- Statista (2025a). Mobile video worldwide.
- Statista (2025b). Social media: TikTok users in Germany.
- Statista (2025c). Social media in Germany.
- Steel, B., Schirmer, M., Ruths, D., & Pfeffer, J. (2025). Just another hour on TikTok: Reverse-engineering unique identifiers to obtain a complete slice of TikTok. arXiv.
- Tang, Y., et al. (2025). Video understanding with large language models: A survey. arXiv.
- Vaswani, A., Shazeer, N., Parmar, N., Uszkoreit, J., Jones, L., Gomez, A. N., Kaiser, L., & Polosukhin, I. (2017). Attention is all you need. arXiv.
- Wang, L., et al. (2023). A survey on large language model based autonomous agents. arXiv.
- Wen, C., Clough, P., Paton, R., & Middleton, R. (2025). Leveraging large language models for thematic analysis: A case study in the charity sector. AI & Society.
- Wilson, E. B. (1927). Probable inference, the law of succession, and statistical inference. Journal of the American Statistical Association.
- Wu, Q., et al. (2023). AutoGen: Enabling next-gen LLM applications via multi-agent conversation. arXiv.
- Yao, S., Zhao, J., Yu, D., Du, N., Shafran, I., Narasimhan, K., & Cao, Y. (2023). ReAct: Synergizing reasoning and acting in language models. arXiv.
- Zhang, W., Deng, Y., Liu, B., Pan, S., & Bing, L. (2024). Sentiment analysis in the era of large language models: A reality check. Findings of the Association for Computational Linguistics: NAACL 2024.
- Zhang, W., Li, X., Deng, Y., Bing, L., & Lam, W. (2022). A survey on aspect-based sentiment analysis: Tasks, methods, and challenges. arXiv.
- Zhou, B., Khosla, A., Lapedriza, A., Torralba, A., & Oliva, A. (2016). Places: An image database for deep scene understanding. arXiv.
- Zimmer, M. (2010). “But the data is already public”: On the ethics of research in Facebook. Ethics and Information Technology.
Footnotes
-
Ethnography studies a cultural group in a natural setting over a period of time (Creswell & Creswell, 2017). ↩
-
Gemini 2.5 Flash-Lite costs $0.10 per million input tokens (text, video, image) and $0.40 per million output tokens including reasoning (Google, 2026). ↩
-
The majority-class floor is the accuracy of always guessing the most common label. ↩
-
A Likert scale records agreement on ordered response options, with raters grading from “strongly disagree” to “strongly agree”, typically on five steps. ↩